
Analyze Dependencies with PSQuickGraph and PSGraphView
PowerShell is excellent at collecting objects. The harder question often comes one step later: how are those objects related?
A table can tell us that an Orders API uses a database, a message broker, and a vault. It is much less useful when we need to answer questions such as:
- What will be affected if Azure Service Bus is unavailable?
- Why does the customer-facing application depend on Key Vault?
- In what order should the platform be deployed or migrated?
- Where are the cycles and tightly coupled groups when the model grows?
Those are graph questions. PSGraph provides
the graph model and algorithms through the PSQuickGraph PowerShell module. The
sibling PSGraphView module renders those
models as Graphviz, Vega, MSAGL, and design structure matrix views.
This article builds one small platform model and uses it for several jobs. The point is not the fictional architecture. The point is that the same native PowerShell objects can support automation, analysis, and documentation without maintaining three separate models.
Two modules with different jobs
The naming is worth explaining before installing anything:
| Name | Responsibility |
|---|---|
PSGraph | The project and GitHub repository. |
PSQuickGraph | The installable module for graph objects, algorithms, GraphML, Graphviz/DOT export, and DSM analysis. |
PSGraphView | The installable visualization module for Graphviz, Vega, MSAGL, and DSM output. |
PSQuickGraph is not the Microsoft Graph API, and it is not the older Graphviz
DSL module named PSGraph. Its focus is an object graph that can be queried and
passed through PowerShell pipelines.
The examples below use the current prerelease pair because the renderer split is new. Pinning the versions makes the article reproducible:
| |
If you only need graph construction and algorithms, PSGraphView is optional.
Model a platform with ordinary objects
The sample inventory contains applications, services, workers, shared platform
services, databases, and observability. There is no required vertex class in the
calling code; each item is a normal PSCustomObject:
| |
Dependencies are data too. In this model an edge points from a consumer to its
dependency: Orders API -> Orders DB means that the API depends on the database.
| |
Build the graph in two passes. Explicitly adding vertices preserves isolated services; adding only edges would omit objects that currently have no relationships.
| |
The sample graph contains 12 vertices and 21 directed edges. The wrapper vertex
retains the original object in OriginalObject, so analysis results can return
to normal PowerShell processing at any time.
First view: the dependency map
PSQuickGraph exports the model as DOT; PSGraphView asks Graphviz to lay it out
and return SVG. Keeping these steps separate is useful: algorithms can run on a
server that never renders an image, while a documentation build can apply its
own visual style.
| |
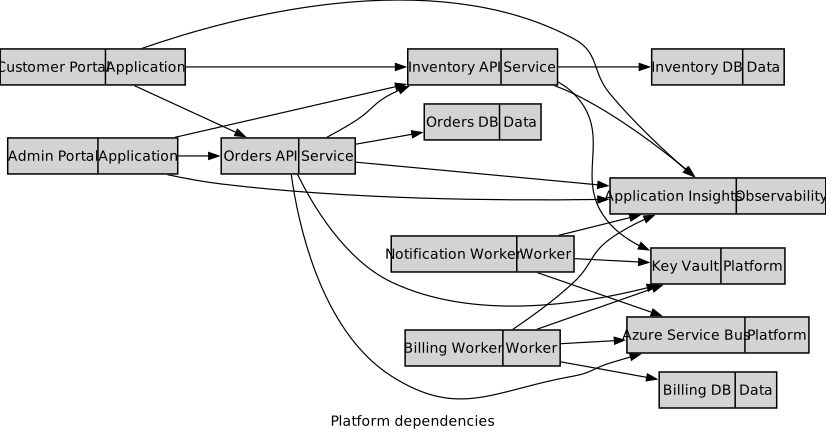
A drawing is already useful for a design review, but the graph becomes more valuable when it answers operational questions.
Immediate dependencies and dependents
Because the edge direction is explicit, outgoing and incoming edges answer two different questions:
| |
The result is still the inventory object, not display text. It can be grouped by team, joined with ownership data, exported to CSV, or used to open incidents.
Explain a dependency with a path
Knowing that two components are connected is not always enough. Get-GraphPath
returns the edge sequence that explains the relationship:
| |
For this model the result is:
| |
This is useful in change reviews and incident response because it provides an explanation, not just a Boolean answer.
Calculate blast radius
Suppose Azure Service Bus is unavailable. Every vertex that can reach it through consumer-to-dependency edges is transitively affected:
| |
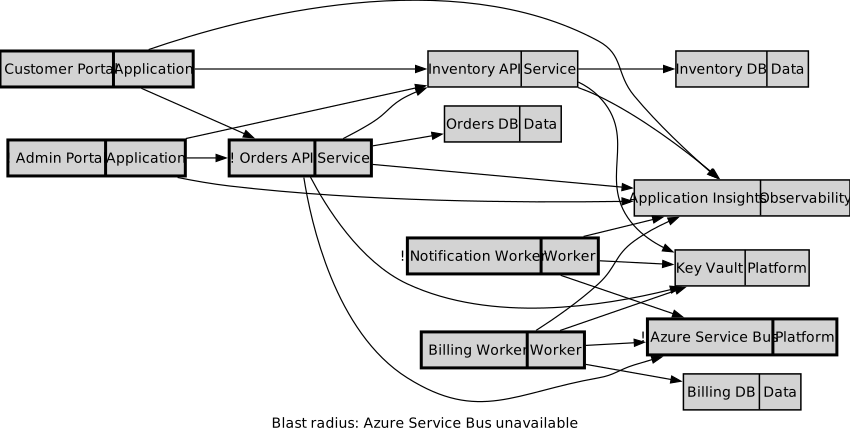
The result includes both direct consumers and applications affected indirectly:
| |
Get-InEdge finds immediate consumers. Test-GraphPath also finds portals that
depend on Service Bus indirectly through Orders API.
Derive a deployment order
The same graph can become an execution plan. With consumer-to-dependency edges, reversing the topological order puts dependencies before their consumers:
| |
The result starts with shared dependencies and ends with applications:
| |
Topological sorting is appropriate only for a directed acyclic graph. If two services depend on each other, the sort fails rather than inventing a safe order. That failure is useful evidence: the cycle needs an explicit migration strategy or an architectural change.
When a node-link diagram becomes too dense
Arrows work well for a dozen components. They become a hairball for a hundred. A design structure matrix (DSM) represents the same edges as cells: the row is the consumer and the column is its dependency.
PSQuickGraph creates and sequences the matrix; PSGraphView renders it:
| |
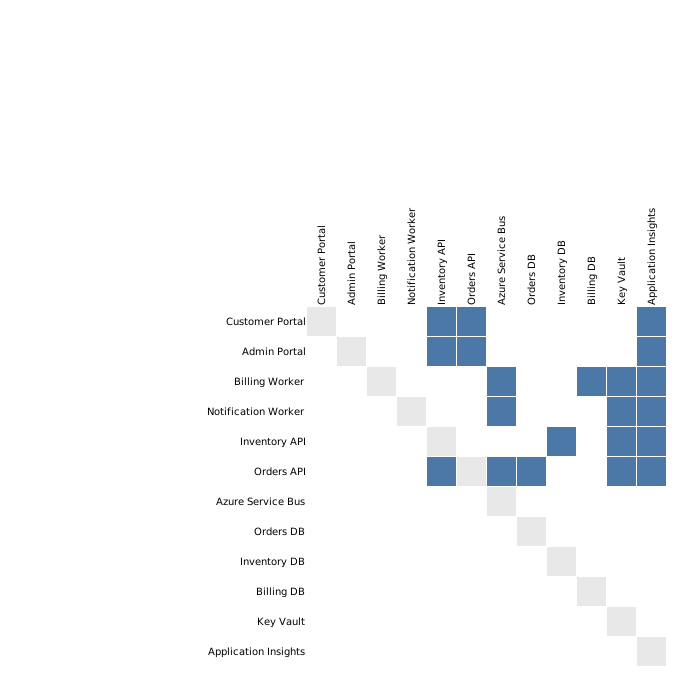
The Vega renderer produces an interactive matrix whose row and column labels can
be highlighted on hover. The static image above uses the same Vega specification
for the article page. For larger models, Start-DSMClustering can group strongly
related components before rendering. That makes the matrix useful for finding
candidate service boundaries, not merely documenting the current state.
Other scenarios for the same pattern
Only the data collection step changes between domains. The graph workflow remains: collect objects, create stable vertices, add directed relationships, ask questions, then choose a view.
- Security events: connect processes, users, hosts, files, and network destinations to reconstruct a suspicious chain.
- Network policy: turn accepted and rejected firewall flows into host and port relationships.
- Infrastructure as code: model semantic Bicep dependencies and validate cross-resource relationships, as shown in Validate Azure Resource Relationships with PSRule and PowerShell Graphs.
- Web diagnostics: connect pages to scripts, APIs, and third-party origins discovered through Chrome DevTools Protocol.
- Execution graphs: use topological order to evaluate a computation graph, as shown in Explore Micrograd with Verso and PowerShell.
These examples look different on screen, but the useful questions are the same: what depends on this, how did we get there, what order is valid, and where is the system too tightly coupled?
Takeaways
PSQuickGraph is most useful when a diagram is not the final product. The graph
can drive impact reports, validation, deployment ordering, and incident
analysis. PSGraphView then turns that same tested model into the representation
that fits the audience: a familiar node-link diagram, an interactive view, or a
dense DSM.
The practical pattern is small:
- Keep vertices as domain objects with stable names or IDs.
- Decide and document the edge direction.
- Use algorithms before reaching for visualization.
- Render from the same model instead of maintaining diagrams by hand.
Once relationships become first-class data, PowerShell can do much more than draw boxes and arrows.
About the Author

Andrey
Developer platforms, PowerShell, Azure, and observable systems
I am a hands-on software architect with more than 20 years of experience building developer platforms, delivery automation, and production infrastructure. I work primarily with PowerShell, C#/.NET, and Azure, turning infrastructure complexity into application-centric self-service workflows using CI/CD, GitOps, Kubernetes, infrastructure as code, and observability.
I build PowerShell tools and write about Azure automation, graph-based infrastructure analysis, messaging, and data visualization. My open-source projects include PSQuickGraph, PSGraphView, ipmgmt, and pubs.
Related Articles
Explore Micrograd with Verso and PowerShell
Verso is an open-source interactive notebook platform and embeddable .NET execution engine. Its language kernels include …
Read moreMicrosoft Graph PowerShell Module: Getting Started Guide
Microsoft Graph PowerShell Module: Getting Started Guide by Jeff Brown Microsoft is retiring the Azure AD Graph API sometime …
Read more